Information on disability of individuals was collected during the Population Enumeration phase of Census 2011 through ‘Household Schedule’ . Similar information was collected during 2001 census also. Information for individuals residing in ‘Normal’, ‘Institutional’ and ‘Houseless’ households were collected.
Disabled Population by Sex and Residence India : 2001-11
| Disabled Population by Sex and Residence India, 2011 | |||
| Residence | Persons | Males | Females |
| Total | 2,68,10,557 | 1,49,86,202 | 1,18,24,355 |
| Rural | 1,86,31,921 | 1,04,08,168 | 82,23,753 |
| Urban | 81,78,636 | 45,78,034 | 36,00,602 |
| Decadal Change in Disabled Population by Sex and Residence, India, 2001-11 | ||||||
| Residence | Absolute Increase | Percentage Decadal Growth | ||||
| Persons | Males | Females | Persons (%) | Males (%) | Females (%) | |
| Total | 49,03,788 | 23,80,567 | 25,23,221 | 22.40 | 18.90 | 27.10 |
| Rural | 22,43,539 | 9,97,983 | 12,45,556 | 13.70 | 10.60 | 17.80 |
| Urban | 26,60,249 | 13,82,584 | 12,77,665 | 48.20 | 43.30 | 55.00 |
Disabled Population by Sex and Residence India : 2011
| Percentage of Disabled to total population India, 2011 | |||
| Residence | Persons | Males | Females |
| Total | 2.21 | 2.41 | 2.01 |
| Rural | 2.24 | 2.43 | 2.03 |
| Urban | 2.17 | 2.34 | 1.98 |
| Percentage of Disabled to total population India, 2001 | |||
| Residence | Persons | Males | Females |
| Total | 2.13 | 2.37 | 1.87 |
| Rural | 2.21 | 2.47 | 1.93 |
| Urban | 1.93 | 2.12 | 1.71 |
Disabled Population by Residence India : 2001-2011

- Percentage of disabled persons in India has increased both in rural and urban areas during the last decade.
- Proportion of disabled population is higher in rural areas
- Decadal increase in proportion is significant in urban areas
Disabled Population by Sex India : 2001-2011


- Slight increase in disability among both the sexes over the decade
- Proportion of disabled population is higher among males
- Decadal Increase in proportion is higher among females
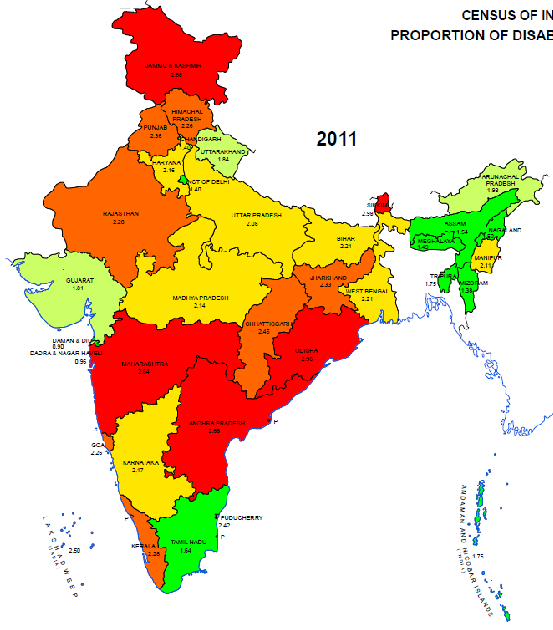
Proportion of Disabled Population India and States/UTs : 2011
Disability by Social Groups India : 2011
| Proportion of Disabled Population by Social Groups India, 2011 | |||
| Social Group | Persons (%) | Males (%) | Females (%) |
| Total | 2.21 | 2.41 | 2.01 |
| Scheduled Castes | 2.45 | 2.68 | 2.20 |
| Scheduled Tribes | 2.05 | 2.18 | 1.92 |
| Other than SC/ST | 2.18 | 2.37 | 1.98 |

Disabled Population by Type of Disability India : 2011
| Disabled Population by Type of Disability India : 2011 | |||
| Type of Disability | Persons | Males | Females |
| Total | 2,68,10,557 | 1,49,86,202 | 1,18,24,355 |
| In Seeing | 50,32,463 | 26,38,516 | 23,93,947 |
| In Hearing | 50,71,007 | 26,77,544 | 23,93,463 |
| In Speech | 19,98,535 | 11,22,896 | 8,75,639 |
| In Movement | 54,36,604 | 33,70,374 | 20,66,230 |
| Mental Retardation | 15,05,624 | 8,70,708 | 6,34,916 |
| Mental Illness | 7,22,826 | 4,15,732 | 3,07,094 |
| Any Other | 49,27,011 | 27,27,828 | 21,99,183 |
| Multiple Disability | 21,16,487 | 11,62,604 | 9,53,883 |
| Proportion of Disabled Population by Type of Disability India : 2011 | |||
| Type of Disability | Persons (%) | Males (%) | Females (%) |
| Total | 100 | 100 | 100 |
| In Seeing | 19 | 18 | 20 |
| In Hearing | 19 | 18 | 20 |
| In Speech | 8 | 8 | 7 |
| In Movement | 20 | 23 | 18 |
| Mental Retardation | 6 | 6 | 5 |
| Mental Illness | 3 | 3 | 3 |
| Any Other | 18 | 18 | 19 |
| Multiple Disability | 8 | 8 | 8 |
Disability by Type and Sex India : 2011

- Disability in seeing and hearing is more among females
- Disability in movement is more among males
Disabled Population by Type and Residence (%) India : 2011

- Disability in hearing and speech is more in urban areas
- Disability in movement and multiple disability is more in rural areas.
Disabled Population by Type and Social Group (%) India : 2011
| Percentage Share of Disabled Population by Type of Disability Among Social Groups India : 2011 |
||||
| Type of Disability | Total | SCs | STs | OTH |
| Total | 100.00 | 100.00 | 100.00 | 100.00 |
| In Seeing | 18.80 | 19.10 | 20.00 | 18.60 |
| In Hearing | 18.90 | 17.40 | 19.30 | 19.20 |
| In Speech | 7.50 | 5.20 | 5.30 | 8.30 |
| In Movement | 20.30 | 20.50 | 22.50 | 20.00 |
| Mental Retardation | 5.60 | 5.10 | 4.90 | 5.80 |
| Mental Illness | 2.70 | 2.40 | 2.60 | 2.80 |
| Any Other | 18.40 | 22.90 | 16.50 | 17.40 |
| Multiple Disability | 7.90 | 7.30 | 8.90 | 7.90 |
Disabled Population by Age and Sex India : 2011
| Proportion of Disabled Population in the Respective Age Groups India : 2011 |
|||
| Age Group | Persons (%) | Males (%) | Females (%) |
| All Ages | 2.21 | 2.41 | 2.01 |
| 0-4 | 1.14 | 1.18 | 1.11 |
| 5-9 | 1.54 | 1.63 | 1.44 |
| 10-19 | 1.82 | 1.96 | 1.67 |
| 20-29 | 1.97 | 2.22 | 1.70 |
| 30-39 | 2.09 | 2.41 | 1.77 |
| 40-49 | 2.31 | 2.66 | 1.94 |
| 50-59 | 2.83 | 3.16 | 2.47 |
| 60-69 | 4.15 | 4.41 | 3.89 |
| 70-79 | 6.22 | 6.26 | 6.19 |
| 80-89 | 8.41 | 8.33 | 8.48 |
| 90+ | 8.40 | 7.88 | 8.85 |
| Age Not Stated | 3.07 | 3.21 | 2.91 |
Proportion of Disabled Population in the respective age groups by sex India : 2011


( Percentage of disabled population to total population of the age group India : 2011 )
Disabled Population by Age and Social Groups India : 2011
| Proportion of Disabled Population in the Respective Age Groups – (SCs, STs and Others) India : 2011 |
||||
| Age Group | Total | SCs | STs | OTH |
| All Ages | 2.21 | 2.45 | 2.05 | 2.18 |
| 0-4 | 1.14 | 1.25 | 0.95 | 1.15 |
| 5-9 | 1.54 | 1.67 | 1.37 | 1.53 |
| 10-19 | 1.82 | 1.98 | 1.64 | 1.81 |
| 20-29 | 1.97 | 2.21 | 1.73 | 1.94 |
| 30-39 | 2.09 | 2.38 | 1.83 | 2.06 |
| 40-49 | 2.31 | 2.64 | 2.14 | 2.26 |
| 50-59 | 2.83 | 3.30 | 2.95 | 2.72 |
| 60-69 | 4.15 | 4.89 | 5.13 | 3.90 |
| 70-79 | 6.22 | 7.45 | 8.45 | 5.81 |
| 80-89 | 8.41 | 9.79 | 11.55 | 7.97 |
| 90+ | 8.40 | 9.06 | 10.30 | 8.14 |
| Age Not Stated | 3.07 | 3.25 | 2.78 | 3.06 |
Source: C-Series, Tables C-20, C-20SC and C-20ST, Census of India 2011
Do you have the statistics of people disabled due to illness in India ?
i want to know disable persond intreasted in sports
This is excellent informative website for disabled persons!
The total percentage of different age group doesn’t add up to the total 2.21% of all age. Can someone please explain this or is there absolute numbers in different age group available?
thanks a lot nice info
Thanks for very good information
special thanks…. for this information ……!!!!!!!!!!!!!!!!!!!!!!!!!! It was very helpful……………..
nice info but i needed info for disabled rural and urban population in 2001 and 2011 not 2001 to 2011
thanks for the information